Formatting Property of Heat Map Chart
* Formatting Settings Menu:-
- The Formatting properties are used to control and apply all the information appearance in Heat Map chart through the categories of General Properties.
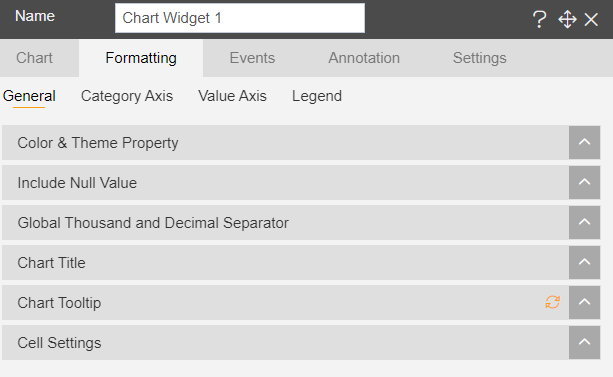
* General Properties:-
The General settings used to add Chart Title, Global Thousand & Decimal Separatopr, Color & Theme Property, Chart Tooltip, Include Null Value and etc....
* Category Axis:-
Category Axis
The Category Axis Property used to modify the Category Axis of Chart by changing Category Type, Category Labels and Category Font Property.

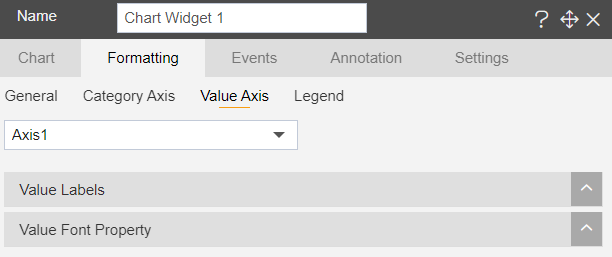
* Value Axis:-
Value Axis
The Value Axis Property used to modify Value Axis of Chart using Value Property, Value Labels, Value Font Property, Value Ticks, VAlue Grid, VAlue Line, etc....
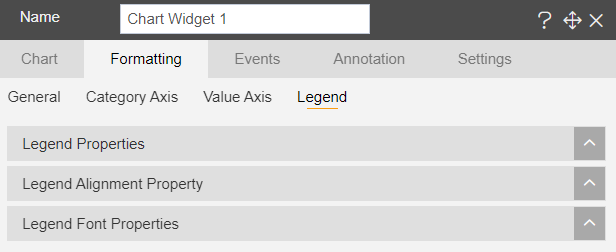
* Legend Properties:-
Legends’s properties are used to add legends to the pie chart and apply user required appearance settings to legends.
To know more about other formatting properties of Radar Chart click on below links:-
1. General Properties
2. Category Axis Property
3. Value Axis Property
4. Legend Properties
In order to understand in detail about Heat Map Chart, click on the following links:-